While we were chatting with a friend, he asked
“Only using metros and walking maximum of 1 km, how much of İstanbul can you see?”.
I always would liked to work with OpenStreetMap and Overpass API, therefore I rolled up my sleeves and researched how to use a map API. In this post, I would like to share my journey of getting used to gathering, processing and visualizing the map data.
Getting the Data
There exist many processed data providers. For example, you may use geofabrik for Europe country specific data or here for other continents as well but I think Overpass API is just amazing. You only need to get used to its query language. Here is an example:
[out:xml]; #
// Node property search
nwr["operator"~"Metro İstanbul"]({{bbox}});
//nwr["network"~"İstanbul Metrosu"]({{bbox}});
//nwr["operator"~"TCDD "]({{bbox}});
//nwr["railway"~"Ulaştırma "]({{bbox}});
out geom;
One aspect I struggled to understand was the data formats. There are many formats to hold map data and you can export to many formats from Overpass API too. Because I would like to process this data on python I also needed a library that can handle such formats. Here is a page that explains different map formats: HOT Export Tool | Export Formats.
Another neat thing about the Overpass API is that the search and filtering depends on your bounding box screen (with the help of ({{bbox}})). So you don’t need to process the whole region or the whole country. Just having the map view covering the entire map is sufficient.
I have chosen .csv because it is quite easy to work with (and I have experience on it). Though another problem I faced was to output csv. For some reason, I had trouble finding the way to output .csv properly in the overpass documentation. After some research, I have come across to the solution:
[out:csv (::id, ::lat,::lon, name)];

nwr["operator"="Metro İstanbul"]({{bbox}});

out geom;
or for bus stops:
[out:csv (::id, ::lat,::lon, name)];

nwr["operator"="İETT"]({{bbox}});
//nwr["network"="İETT"]({{bbox}});
//nwr["highway"="bus_stop"]({{bbox}});

out geom;
Additionally, if you would like to filter two keywords at the same time:
nwr["highway"="bus_stop"]["network"="İETT"]({{bbox}});
İstanbul Specific Data Collection
İBB has it’s own open data portal that shares many data including public transportation related ones. There exists one about the location of railed systems (just newly updated on 5 Jan 2025).
Choice of Library
Like I mentioned, there are many libraries in python for map visualization or map data processing. A couple of examples:
- pyosmium
- Examples directory is helpful.
- Before outputting csv, I was trying to work on OSM. Filtering an OSM Flie by Tag from the documentation is a nice resource.
- plotly
- It looks fantastic, not only for map visualization but also other graphics, charts and tables. I think it is a great matplotlib alternative.
- This specific example looked promising for me.
- geopandas
- It is an extension of pandas library to allow spatial operations on geometric types.
- You can easily add a background on your plot.
- folium
- Interactive leaflet in python. Visualizing points or areas is super simple.
Methodology
The method is straightforward: draw a circle of radius R around each bus/metro station, then calculate the total area covered—accounting for overlapping regions—and subtract it from the total area of Istanbul.
For calculating union, I have used shapely’s unary_union method which simplified everything a lot.
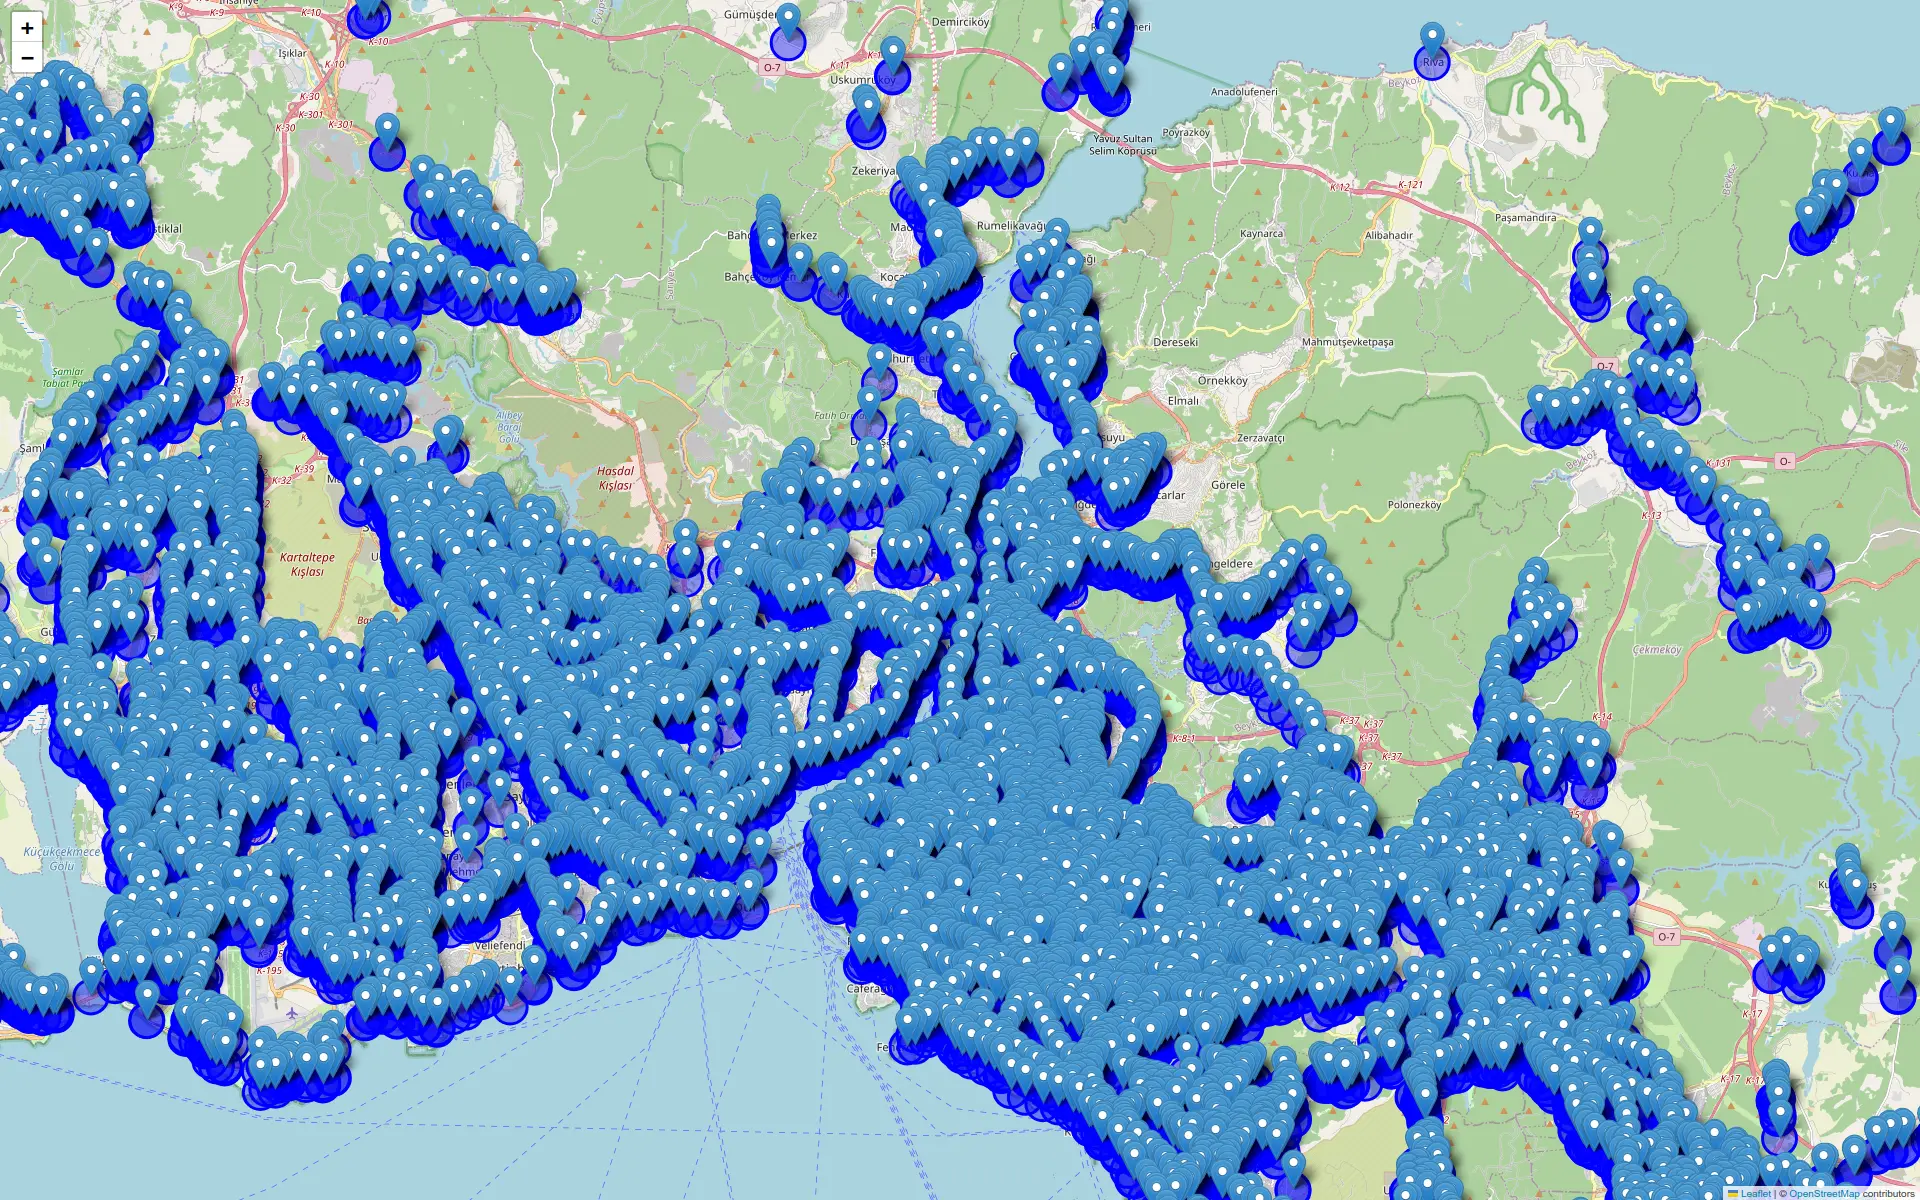
Answer to the initial question
Here are total areas of that circles (accounting overlapping):
| Mode | 100m | 500m | 1000m |
|---|---|---|---|
| Bus | 185.84 km² | 1513.76 km² | 2439.00 km² |
| Metro | 10.37 km² | 223.61 km² | 661.17 km² |
If we say İstanbul to have an area of 5461 km2 (including forests and other non-city places too), then each of the above values can be expressed as percentages:
| Mode | 100m | 500m | 1000m |
|---|---|---|---|
| Bus | 3.40% | 27.7% | 44.66% |
| Metro | 0.18% | 4.09% | 12.10% |
Final Thoughts
In future work, I intend to exclude non-urban areas from the analysis. Since much of Istanbul’s 5461 km2 total area is uninhabited, recalculating coverage based strictly on populated zones will yield a more accurate representation of transit accessibility.
As always, script can be accessed in github.